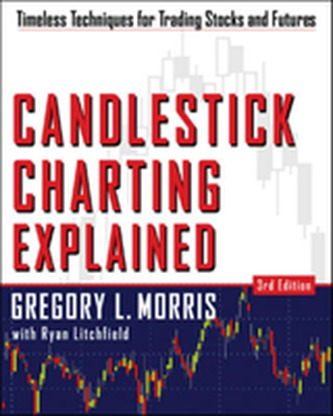
Candlestick Charting Explained
1712 Kč
Odesíláme do 3 až 5 dní
Sleva až 70% u třetiny knih
Shows you candlestick charting, one of the most popular tools in technical analysis. Featuring charts and analysis, this work presents material on integrating Western charting analysis with Japanese candlestick analysis, grouping candlesticks into families, detecting and avoiding false signals, and more.
| Autor: | Morris, Greg L. |
| Nakladatel: | McGraw-Hill Education - Europe |
| ISBN: | 9780071461542 |
| Rok vydání: | 2006 |
| Jazyk : | Angličtina |
| Vazba: | Paperback |
| Počet stran: | 560 |
Mohlo by se vám také líbit..
-

Rebuilding Your Life after Stroke
Morris, Greg L.
-

How to Make Money in Stocks: A Winn...
William O`Neil
-

Security Analysis
Benjamin Graham
-

Way of the Turtle: The Secret Method...
Faith Curtis
-

Trade Like a Stock Market Wizard: Ho...
Minervini, Mark
-
Schaum's Outline of Statistics ...
Salvatore, Dominick; Diulio, Eugene A.
-

How to Make Money in Stocks Success ...
Investor's Business Daily; Smith, Amy; O'Neil, William J.
-

The Futures Game
Teweles, Richard; Jones, Frank J.
-

All About Candlestick Charting
Corbitt, Wayne A.
-
High-Probability Trading
Marcela Linková
-

Stabilizing an Unstable Economy
Minsky, Hyman P.
-
Elliot Wave Techniques Simplified: H...
McDowell, Bennett A.
-
Technical Analysis from A to Z
Achelis, Steven B.
-

SHIFT: How Top Real Estate Agents Ta...
Gary Keller
-

24 Essential Lessons for Investment ...
William O`Neil
-
How to Trade In Stocks
Livermore, Jesse


