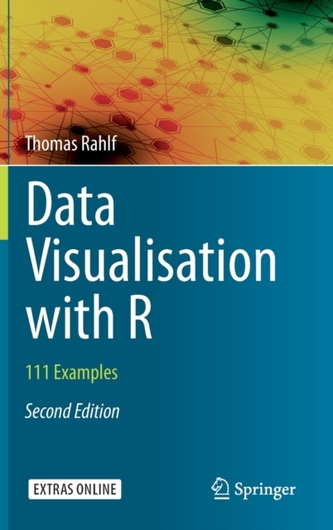
Data Visualisation with R
2244 Kč
Sleva až 70% u třetiny knih
It shows how bar and column charts, population pyramids, Lorenz curves, box plots, scatter plots, time series, radial polygons, Gantt charts, heat maps, bump charts, mosaic and balloon charts, and a series of different thematic map types can be created using R\'s Base Graphics System.
| Autor: | Rahlf, Thomas |
| Nakladatel: | Springer Nature Switzerland AG |
| ISBN: | 9783030284435 |
| Rok vydání: | 2019 |
| Jazyk : | Angličtina |
| Vazba: | Hardback |
| Počet stran: | 451 |
Mohlo by se vám také líbit..
-

Quantum Computing: An Applied Approach
Hidary, Jack D.
-

Techlash
Mitroff, Ian I.
-

Financing the Green New Deal
Hockett, Robert C.
-

Probability Theory
Klenke, Achim
-

Deep Learning Architectures
Calin, Ovidiu; Chang, Der-Chen; Furutani, Kenro; Iwasaki, Chisato
-

Audio Technology, Music, and Media
Ashbourn, Julian
-

Core Data Analysis: Summarization, C...
Mirkin, Boris
-

Gamechanger AI
Henning, Klaus
-

Internet Computing
-

Managing Industrial Services
-

Freedom and Evolution
Nield, Donald A.; Bejan, Adrian
-

Radio and Radar Astronomy Projects fo...
Aboudi, Jacob; Arnold, Steven M.
-

Statistical Field Theory for Neural ...
Helias, Moritz; Dahmen, David
-

How to Drive a Nuclear Reactor
Polsky, Colin; Tucker, Jane, PhD
-

Economics of Bioresources
-

Thermal Stresses-Advanced Theory and...
Hetnarski, Richard B.; Eslami, M. Reza


